UML Diagram Template
Model and design software at ease. With Miro’s UML diagram template, your team can visualize processes, development, and behavior with a unified language.
Trusted by 65M+ users and leading companies


About the UML Diagram Template
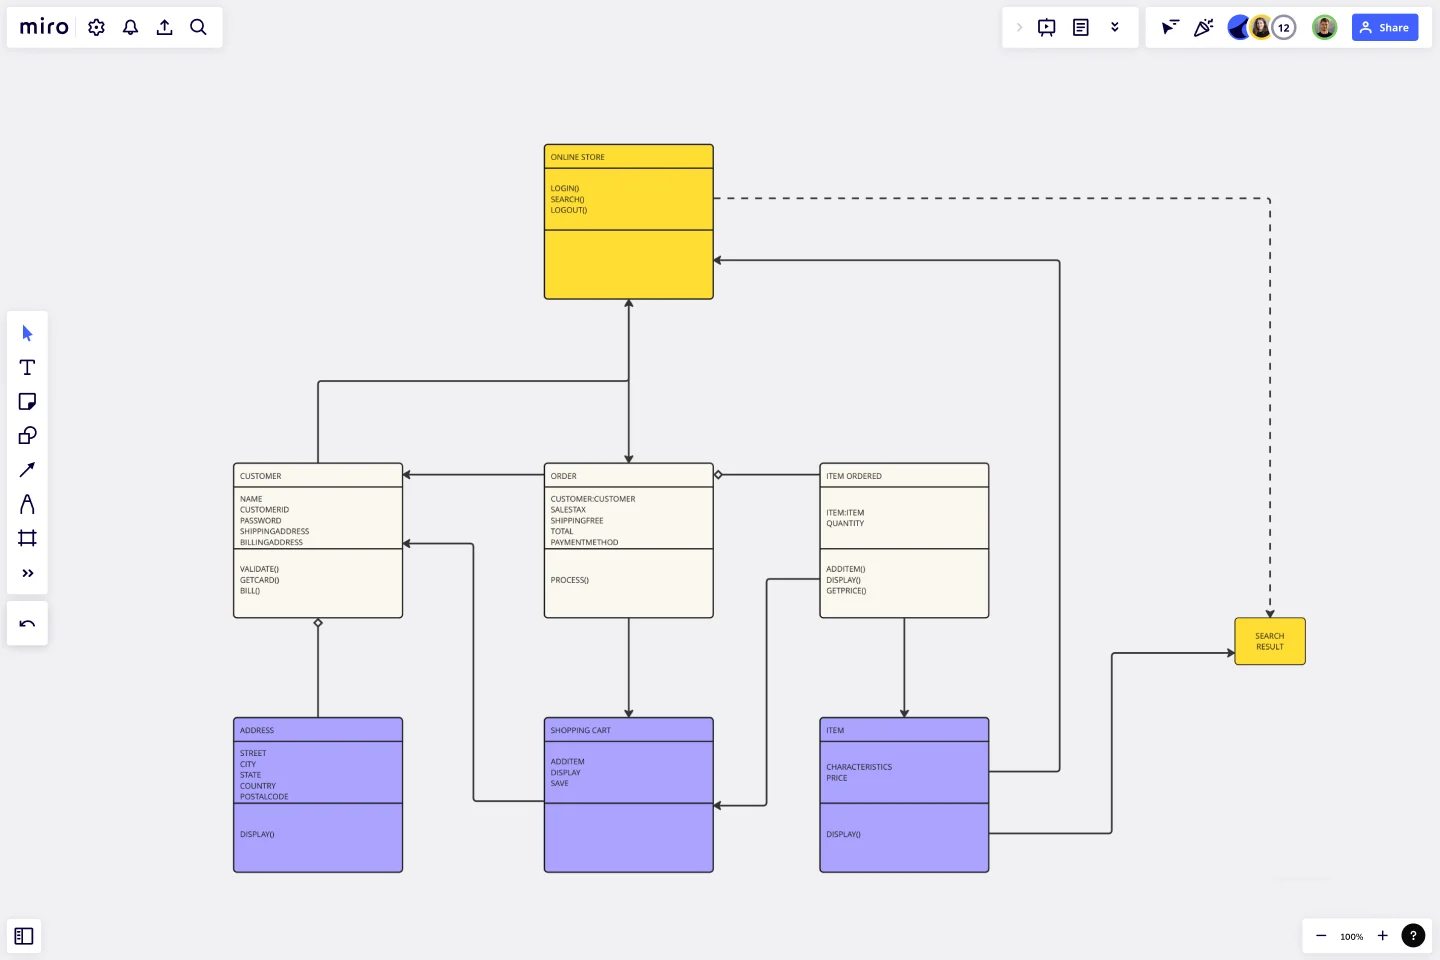
Miro’s UML diagram template is a free and customizable visual tool for mapping out step-by-step processes and visualizing software systems. UML, which stands for Unified Modeling Language, was initially used as a modeling language in software engineering, but it’s now a widely used approach to diagramming application structures, modeling, and documenting software. Professionals from various sectors use UML diagrams to model business processes and workflows.
We’ll walk you through how to use Miro’s UML diagram template and share more about its benefits.
How to create a UML diagram using Miro’s template
To open Miro’s UML diagram template, click on the blue “use template” button on this page. Once you’re in, here are a few steps you can take to start filling the template in and making it your own:
1. Identify your target audience
When deciding which type of UML diagram best fits your needs, start by choosing your target audience. For example, executives are probably only interested in the big picture, while developers need as much detail as possible. Knowing who you’re targeting will inform how much information to add to the UML diagram template.
2. Label the shapes
Once you’re ready to populate the UML diagram template, double-click on the shapes to add text. The shapes are divided into three color sections, allowing you to establish a hierarchy among the content you’re adding. Duplicate or remove these shapes as needed.
3. Rearrange the connection lines
The UML diagram template comes with connection lines, allowing you to depict the relationship between the shapes. Drag them around to adjust the order you want your shapes to appear. Duplicate or remove any lines as needed.
4. Customize the template
Change up shape sizes, colors, arrow directions, and line styles to customize the look and feel of your UML diagram template. You can also use color to indicate important information you’d like to draw your audience’s attention to.
Advantages of using a UML diagram template
Like flowcharts, UML diagrams can provide your organization with a standardized method of mapping out step-by-step processes. They allow your team to view the relationships between systems and tasks easily. Though they were originally for software engineers, UML diagrams have become popular in other industries too for their ability to simplify the system design process.
Using Miro’s UML diagram template makes it easy for your team to visualize complex systems by saving you time from having to build a diagram from scratch. Plus, between our UML diagramming shape pack, intuitive drag-and-drop interface, and powerful collaboration features, you’ll create a clear and visually compelling UML diagram in no time.
Need to make changes after you’re done? You can easily edit your UML diagram template over time, allowing you to keep your content fresh and up to date.
Is Miro’s UML diagram template free?
Yes, Miro’s UML diagram template is free and ready to use, though you’ll need a Business, Enterprise, or Education plan to access the full UML shape pack. Visit our Help Center to learn more about accessing different shape packs.
When to use a UML diagram template
You can use a UML diagram template to model software development by helping design and analyze the software, besides guiding development and team prioritization. They have become a popular way to model business processes or workflows. UML diagrams are an effective tool that can help you bring various stakeholders up to speed, create documentation, organize your workplace and team, and streamline your projects.
Can you draw various UML diagrams with Miro?
Yes. Miro is a visual workspace for innovation, allowing you to customize UML diagrams according to your needs and audience. The UML diagrams are mainly divided into two categories: structural and behavioral. 14 UML diagram examples are split into these two categories, and you can use Miro’s features to design for both.
Get started with this template right now.
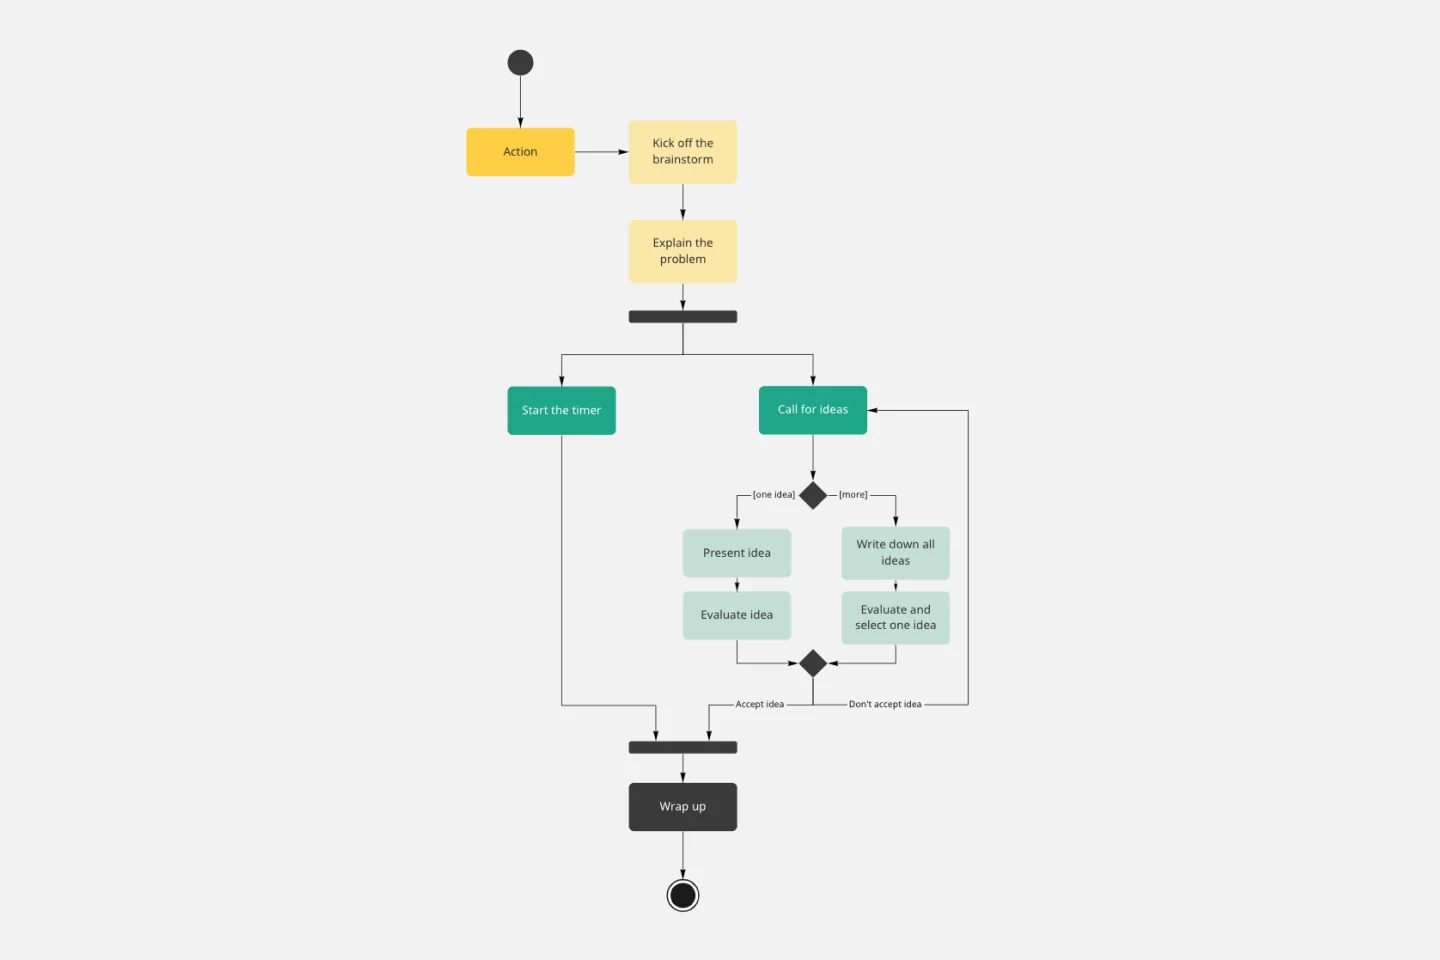
UML Activity Diagram Template
Works best for:
Diagrams
Use our Activity Diagram template to break down activities into smaller decisions and subprocesses. Improve and optimize systems and processes in I.T., business management, and more.
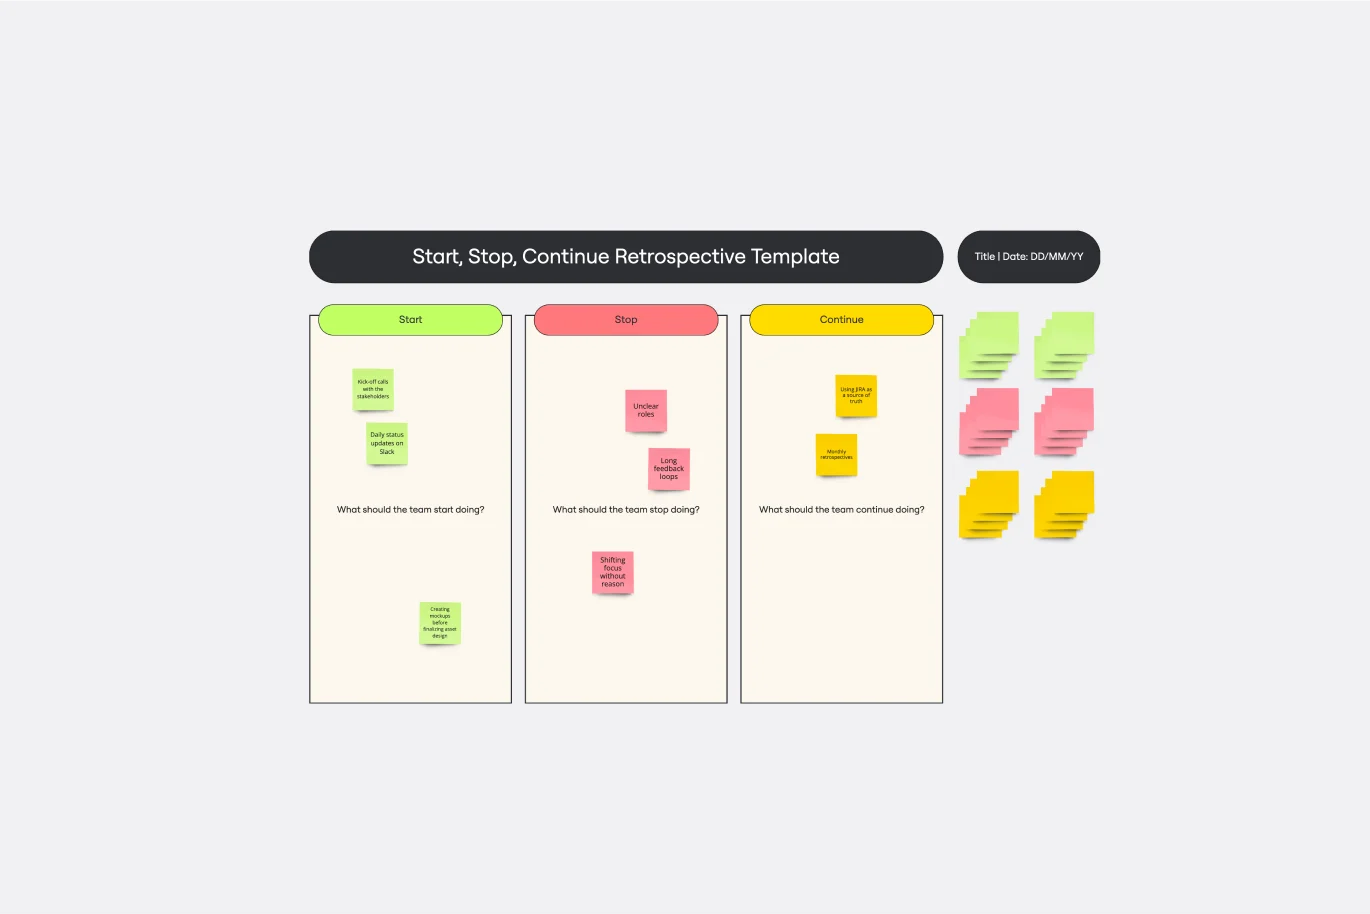
Start, Stop, Continue Template
Works best for:
Retrospectives, Meetings, Workshops
Giving and receiving feedback can be challenging and intimidating. It’s hard to look back over a quarter or even a week and parse a set of decisions into “positive” and “negative.” The Start Stop Continue framework was created to make it easier to reflect on your team’s recent experiences. The Start Stop Continue template encourages teams to look at specific actions they should start doing, stop doing, and continue doing. Together, collaborators agree on the most important steps to be more productive and successful.
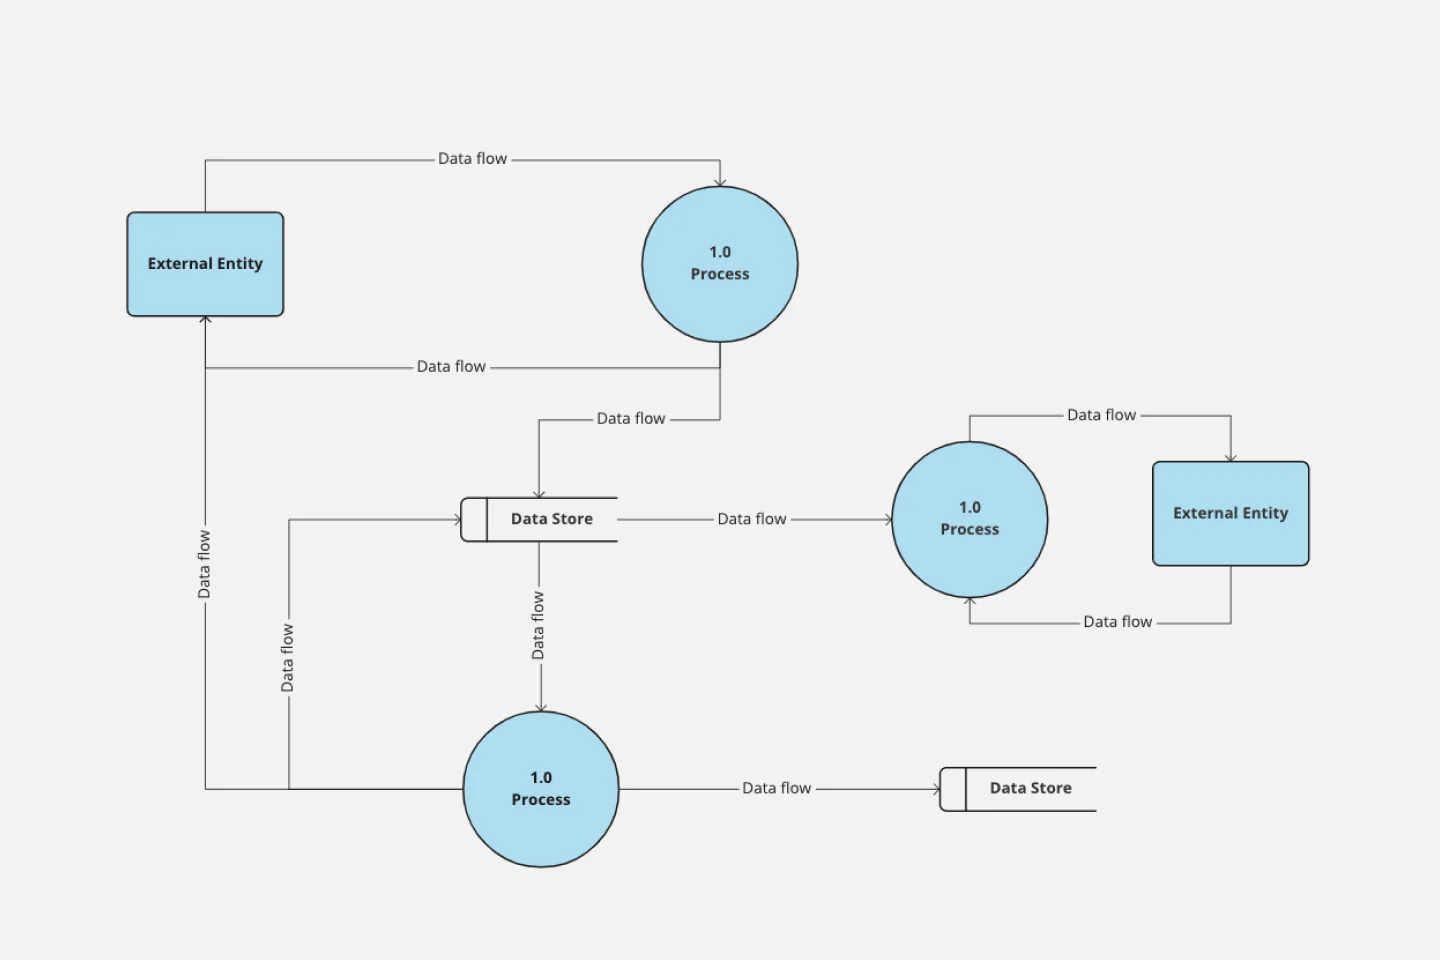
Data Flow Diagram Template
Works best for:
Flowcharts, Software Development, Diagrams
Any process can get pretty complex, especially when it has multiple components. Get a better grasp of your process through a data flow diagram (DFD). DFDs create a simple visual representation of all components in the flow of data and requirements in an entire system. They’re most often used by growth teams, data analysts, and product teams, and they’re created with one of three levels of complexity—0, 1, or 2. This template will help you easily build the best DFD for your process.

UML State Machine Diagram Template
Works best for:
Software Development, Mapping, Diagrams
Visualize the workflow of a process and how objects perform actions based on different stimuli. State machine diagrams are valuable for understanding how an object responds to events at the different stages of its life cycle. They are also helpful for visualizing event sequences in a system.
Customer Touchpoint Map Template
Works best for:
Desk Research, Product Management, Mapping
To attract and keep loyal customers, you have to truly start to understand them—their pain point, wants, and needs. A customer touchpoint map helps you gain that understanding by visualizing the path your customers follow, from signing up for a service, to using your site, to buying your product. And because no two customers are exactly alike, a CJM lets you plot out multiple pathways through your product. Soon you’ll be able to anticipate those pathways and satisfy your customers at every step.

Azure Demand Forecasting Template
Works best for:
Software Development, Diagrams
The Azure Demand Forecasting diagram will show the architecture of a demand forecast, making it easier for you to predict data consumption, costs, and forecast results. Azure is Microsoft’s cloud computing platform, designed to provide cloud-based services such as remote storage, database hosting, and centralized account management. Azure also offers new capabilities like AI and the Internet of Things (IoT).