Flowchart Template
Say goodbye to bottlenecks — map out any process seamlessly using Miro’s easy-to-use flowchart template.
Trusted by 65M+ users and leading companies


About the Flowchart Template
A flowchart is a visual tool for representing processes. It typically consists of symbols and shapes that represent the various steps of a process, as well as connection lines to depict the flow between them. While you can easily build your own flowchart from scratch, Miro’s flowchart template saves you time by providing you with a ready-to-use chart. All you have to do is open it, fill it in, and further customize it to make it your own. We’ll show you how in the next section.
How to use Miro’s flowchart template
To get started, scroll to the top of this page and click on the blue “Use template” button. That’ll open the flowchart template on a blank Miro board, allowing you to start filling it in. Once you’re there, here are five steps to make the most of our flowchart template.
1. Decide on a process to visualize
Before you can start filling the flowchart template in, make sure you’re clear on what process you’re trying to visualize. If you’re collaborating on the flowchart template with others, be sure to invite them to edit your Miro board with you.
2. Get familiar with the flowchart template
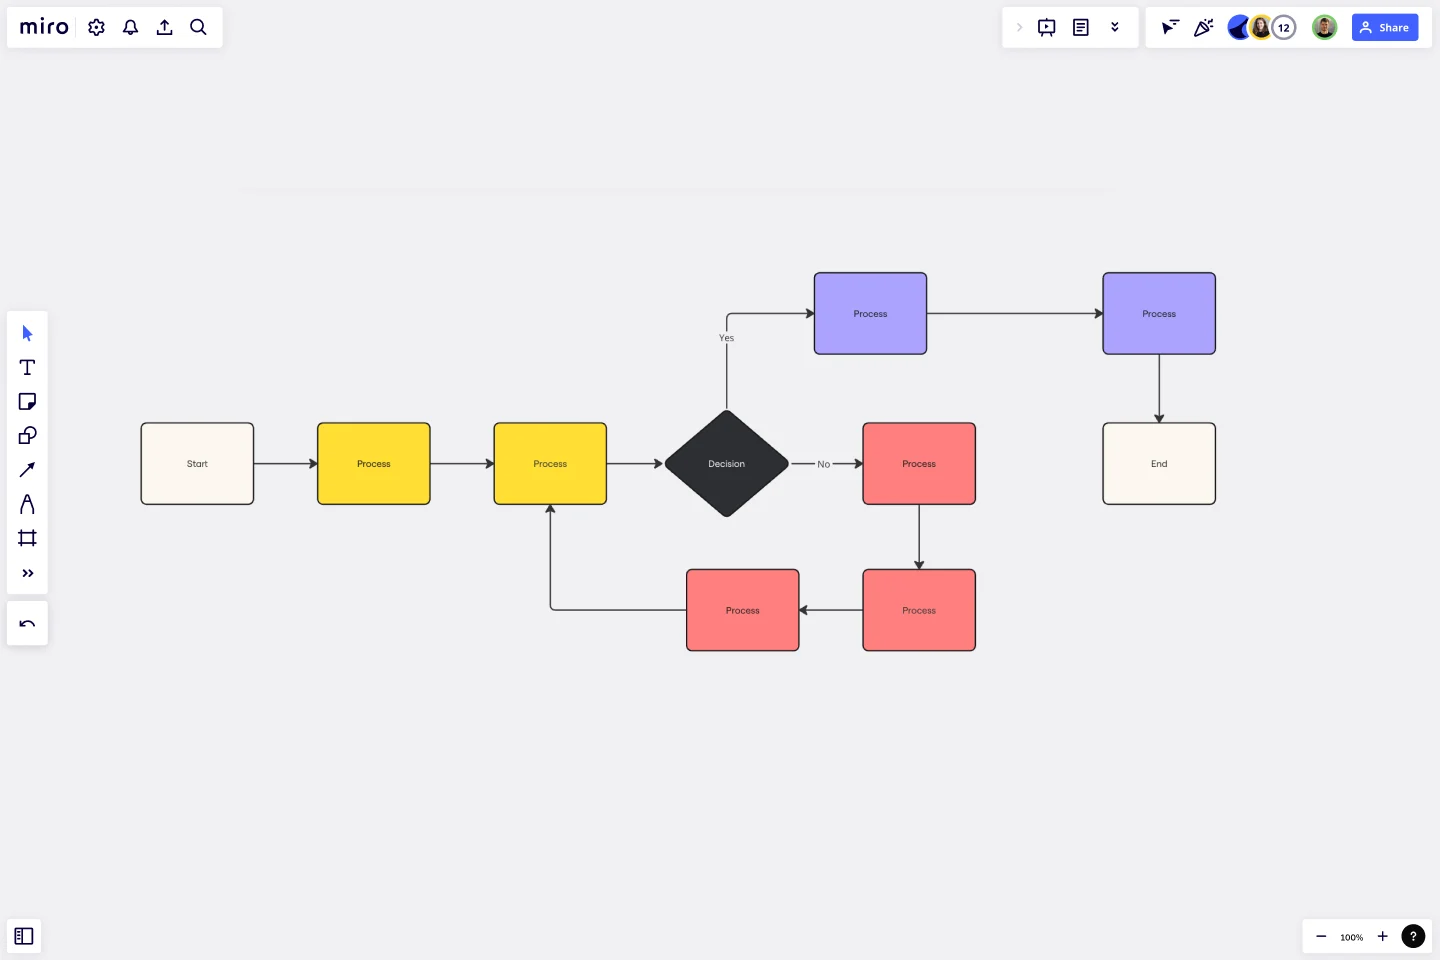
The flowchart template comes with pre-made shapes containing text boxes. The black rectangles with rounded corners represent the starting and ending points of your flowchart. The rectangles with sharp corners represent the different actions you could take, while the diamond represents a decision you need to make as a result of those actions. As your reader moves through your flowchart, the arrows between the shapes are meant to help them identify the next step in the process.
3. Fill in the flowchart template
Let’s say you’re visualizing the steps someone could take when they wake up in the morning. Fill in the first yellow rectangle with “wake up.” In the orange diamond, write down a question this person might have to answer in order to decide what to do after waking up, such as “Is it a weekday?”
From there, you’ll see two arrows labeled “yes” and “no,” each leading to a follow-up action you could take based on your answer to the previous question. If the answer is yes – meaning it is a weekday – the connecting pink rectangle should identify the next step, such as “get out of bed.” Repeat this for the remaining pink rectangle. You could write, “Go back to bed,” as a result of it not being a weekday.
In the final black rectangles with rounded corners, write down what the outcome of each path is. For example, you could write “Get ready for work” as the outcome of getting out of bed and “Sleep in” as the outcome of going back to bed.
4. Add more symbols and arrows
Need more shapes and arrows to visualize your process? No problem — editing the flowchart template is easy. Simply click on any shape to reveal the blue dots around it, and click on the one where you’d like to add a new pathway. From there, you can easily change the shape’s color or even move it around to place it exactly where you want it on the flowchart template.
5. Customize your flowchart template
Done filling in your flowchart template? Time to customize the look and feel — whether you want to align your flowchart with your brand style or simply have fun. Highlight any element of your flowchart to edit it, and use the pop-up menu to customize everything from line thickness to font types. You can even change your Miro board’s background color.
Benefits of using Miro’s flowchart template
There are several benefits of making an online flowchart. On top of saving you time from having to build a flowchart from scratch, using Miro’s template lets you easily customize it using built-in diagramming tools. Need a few extra hands? Invite collaborators to fill in and customize your flowchart template in real time, even if you aren’t all in the same room. Want to share your flowchart template for feedback before finalizing it? Invite others to view and comment on your Miro board, and have them easily tag you in messages so you never miss a beat.
When you’re ready to seal your flowchart template and make it official with your team, simply export your Miro board so you can send it as an email or instant message attachment.
Is Miro’s flowchart template free?
Yes, Miro’s flowchart template is 100% free to use. Simply scroll to the top of the page and click on the blue “use template” button to get started.
Can I create my own custom flowchart template?
Absolutely, Miro's intuitive interface makes it easy to design your own flowchart template and share it with others. Feel free to experiment with shapes, colors, and lines to mirror your individual style or company's branding guidelines. Save your custom template for future projects, providing an efficient starting point each time.
When to use a flowchart template?
Most project managers use the flowchart template from the start. This helps align teams early on and quickly and helps them avoid having to explain processes multiple times down the line. But using a flowchart template isn’t limited to new projects. Think about any existing processes or workflows that your teammates aren’t always on the same page about. A flowchart would help maintain one source of truth, and using a template saves you time from having to create an elaborate visualization from scratch — allowing you to stay focused on work.
Get started with this template right now.

Stage-Gate Process Flowchart Template
Works best for:
Diagramming, Project Management
The Stage-Gate Process Flowchart Template structures a project into distinct stages separated by decision-making gates, enhancing the quality of decisions and leading to more successful project outcomes.
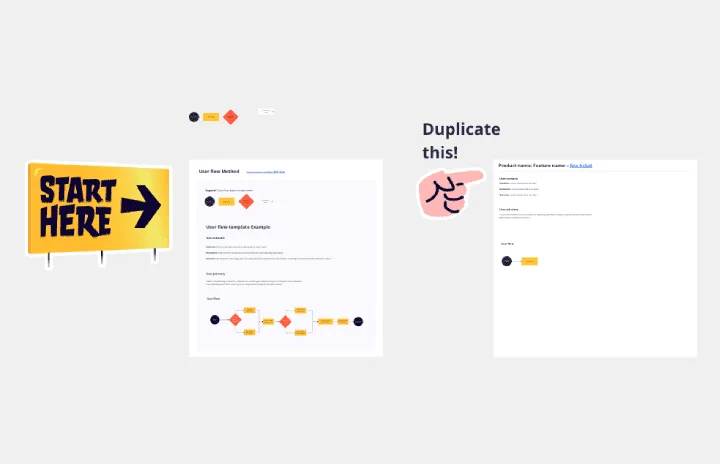
User Flow Example
Works best for:
Flowcharts, Mapping, Diagrams
The User Flow Example template offers a visual representation of a typical user flow within a digital product or service. It provides elements for documenting user interactions, navigation paths, and decision points along the user journey. This template enables UX designers and product teams to understand user behavior, identify pain points, and optimize the user experience. By providing a concrete example of user flow, the User Flow Example template serves as a valuable reference for designing intuitive and engaging digital experiences that meet user needs effectively.
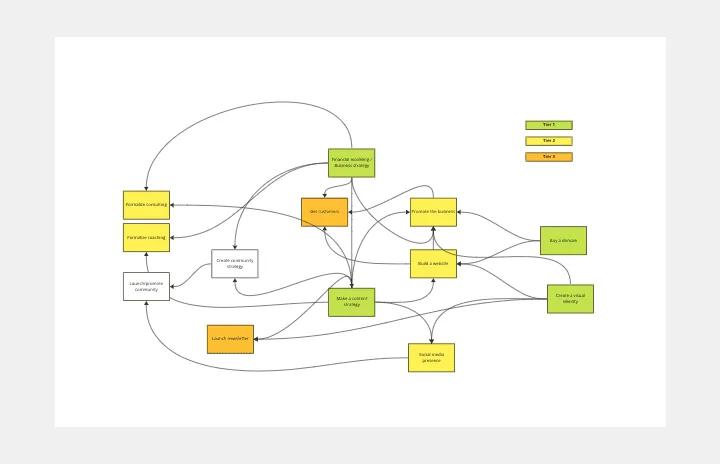
Interrelationship Diagram
Works best for:
Diagramming
The Interrelationship Diagram template is a visual tool for analyzing and illustrating complex relationships between variables or elements within a system. It provides a structured framework for mapping out connections, dependencies, and interactions. This template enables teams to visualize patterns, identify causal relationships, and uncover insights into system behavior. By promoting systems thinking and understanding of interdependencies, the Interrelationship Diagram empowers organizations to make informed decisions and drive effective solutions to complex problems.
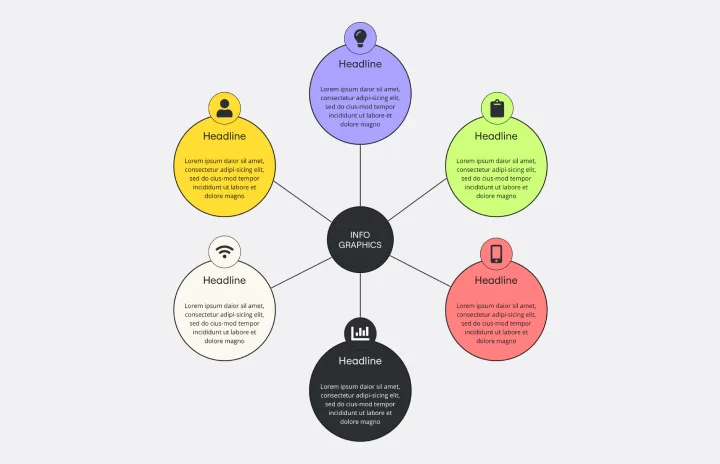
Web Diagram Template
Miro's Web Diagram Template simplifies complex project organization and promotes effective communication. It allows users to easily connect elements and gain a comprehensive understanding of complex relationships, making it a versatile and invaluable asset for diverse projects.
Agile Retrospective
Works best for:
Retrosprective, Agile Methodology, Meetings
The Agile Retrospective template offers a dynamic and adaptive framework for teams practicing agile methodologies. It provides elements for reflecting on sprint performance, identifying bottlenecks, and planning improvements. This template enables teams to adapt and refine their processes continuously, fostering a culture of learning and innovation. By promoting agility and adaptability, the Agile Retrospective empowers teams to optimize their workflows, drive continuous improvement, and deliver value to their stakeholders effectively.

UML State Machine Diagram Template
Works best for:
Software Development, Mapping, Diagrams
Visualize the workflow of a process and how objects perform actions based on different stimuli. State machine diagrams are valuable for understanding how an object responds to events at the different stages of its life cycle. They are also helpful for visualizing event sequences in a system.