PERT Chart Template
Track project timelines, tasks, and dependencies at a single glance using a PERT chart template.
Trusted by 65M+ users and leading companies


About the PERT Chart Template
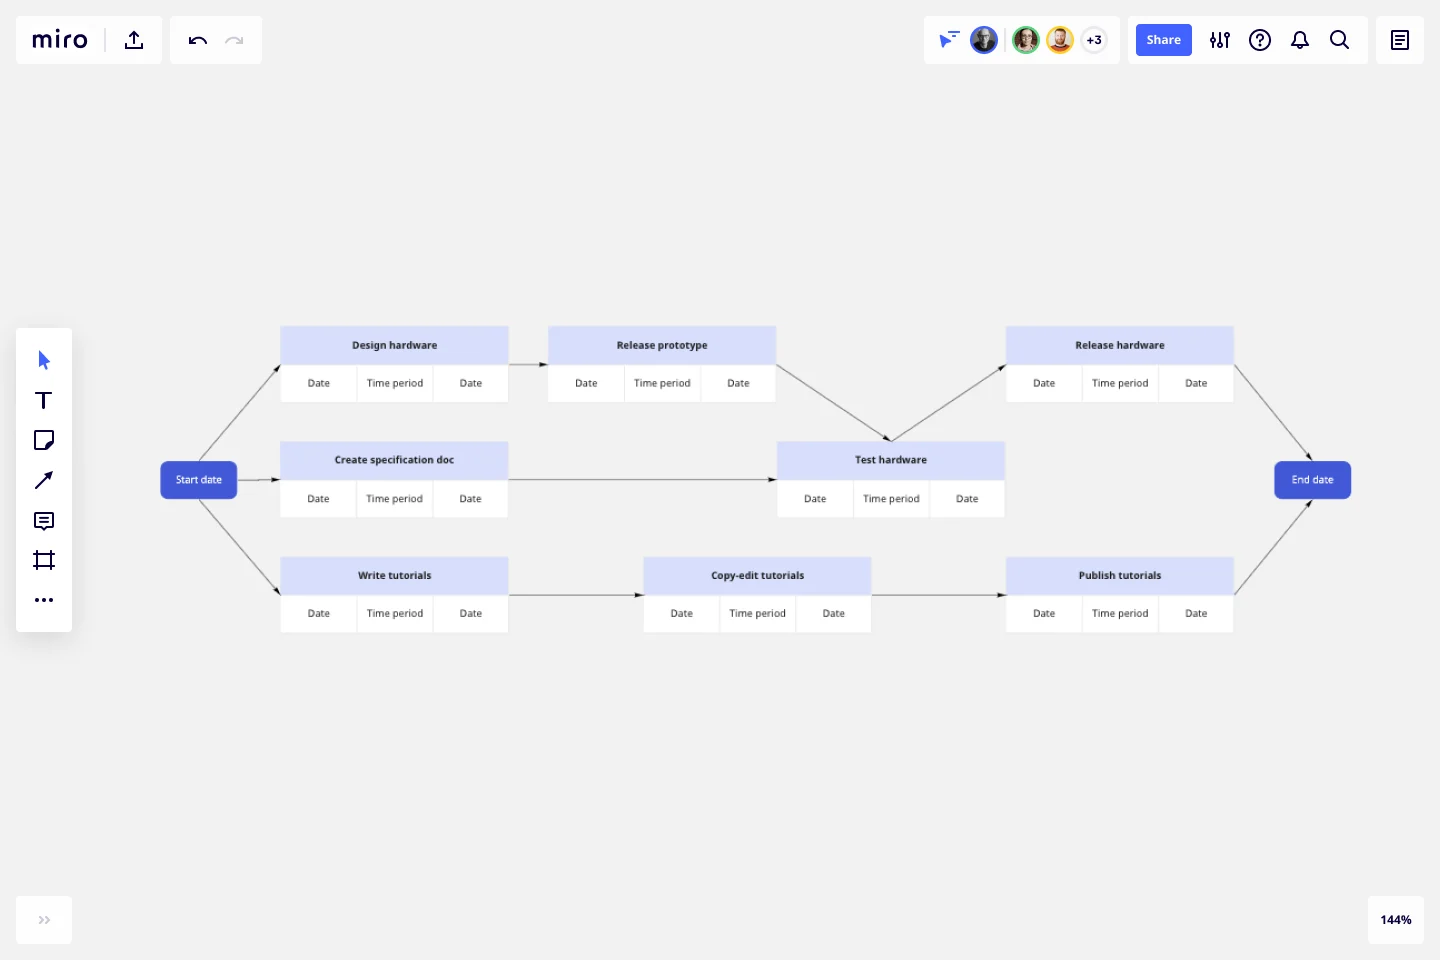
Miro’s PERT chart template is a project management tool that allows you to create a visual roadmap for your project. Designed to let you see interdependencies and to help you identify possible bottlenecks, this template consists of nodes and vectors that are easy to fill out and customize.
We’ll walk you through how to make the most of the PERT chart template.
How to use the PERT chart template
To get started, click on the blue “use template” button to open the PERT chart template in Miro. Once you’re in, follow the steps below to start filling it out.
1. Identify project tasks
Break your project down into tasks. Then, label the blue headers along the nodes with the task names. Double-click on the pre-written text to replace it with your own. Below the blue headers, add each task's expected start and end dates and the estimated durations by double-clicking on the text boxes.
2. List task dependencies
Are there any tasks you can’t start until another one’s been completed first? That means you have dependencies. Use the arrows in the PERT chart template to connect dependent tasks, and make sure the direction represents the order you need to complete them.
4. Label dependencies
Add more detail to clarify the nature of each dependency by labeling the arrows with one of the following:
Finish-to-Start (FS): You can’t start a task until you’ve completed the preceding task.
Start-to-Start (SS): You can start a task as soon as you’ve started its preceding task.
Finish-to-Finish (FF): You can’t finish a task until you’ve completed the preceding task.
Start-to-Finish (SF): You can’t finish a task until you’ve started the preceding task.
Grab text boxes from the toolbar and place them along the arrows to add your labels.
6. Identify a critical path
Use the estimated durations to calculate the critical path. Then, use colors to outline nodes or arrows to visualize it.
7. Share your diagram
Once you’ve filled in the PERT chart template, you can share it with your team and key stakeholders for feedback and easily make changes to your Miro board anytime.
Benefits of using Miro’s PERT chart template
Miro’s PERT chart template makes it especially easy to manage projects that involve multiple team members and stakeholders. With advanced collaboration features at your fingertips, you can easily build a PERT chart together online in real-time or invite others to view and comment on your Miro board when you’re ready — making it an ideal solution for remote and hybrid teams.
The PERT chart template is also fully customizable, allowing you to take advantage of Miro’s extensive editing features — from resizing nodes and text to changing up colors and line thickness.
Is Miro’s PERT chart template free?
Yes, all our templates are free and ready to use. Simply click on the blue “Use template” button to get started.
Can I share the PERT chart template with others outside my team?
Yes, there are several ways to share the PERT chart template. Export your Miro board as a PDF or image to attach it as a file to a message. Alternatively, you can embed your Miro board on other sites or generate a shareable link to send to others.
What is the critical path in a PERT chart?
A critical path shows the longest path of essential tasks you must complete to finish a project. For example, you can't move on to do the upholstery and interior if you haven't finished putting up the walls and roof. When one of these tasks is late, it impacts the entire project. To make up for missed deadlines on critical tasks, reallocate resources and staff from the low-impact tasks.
Get started with this template right now.
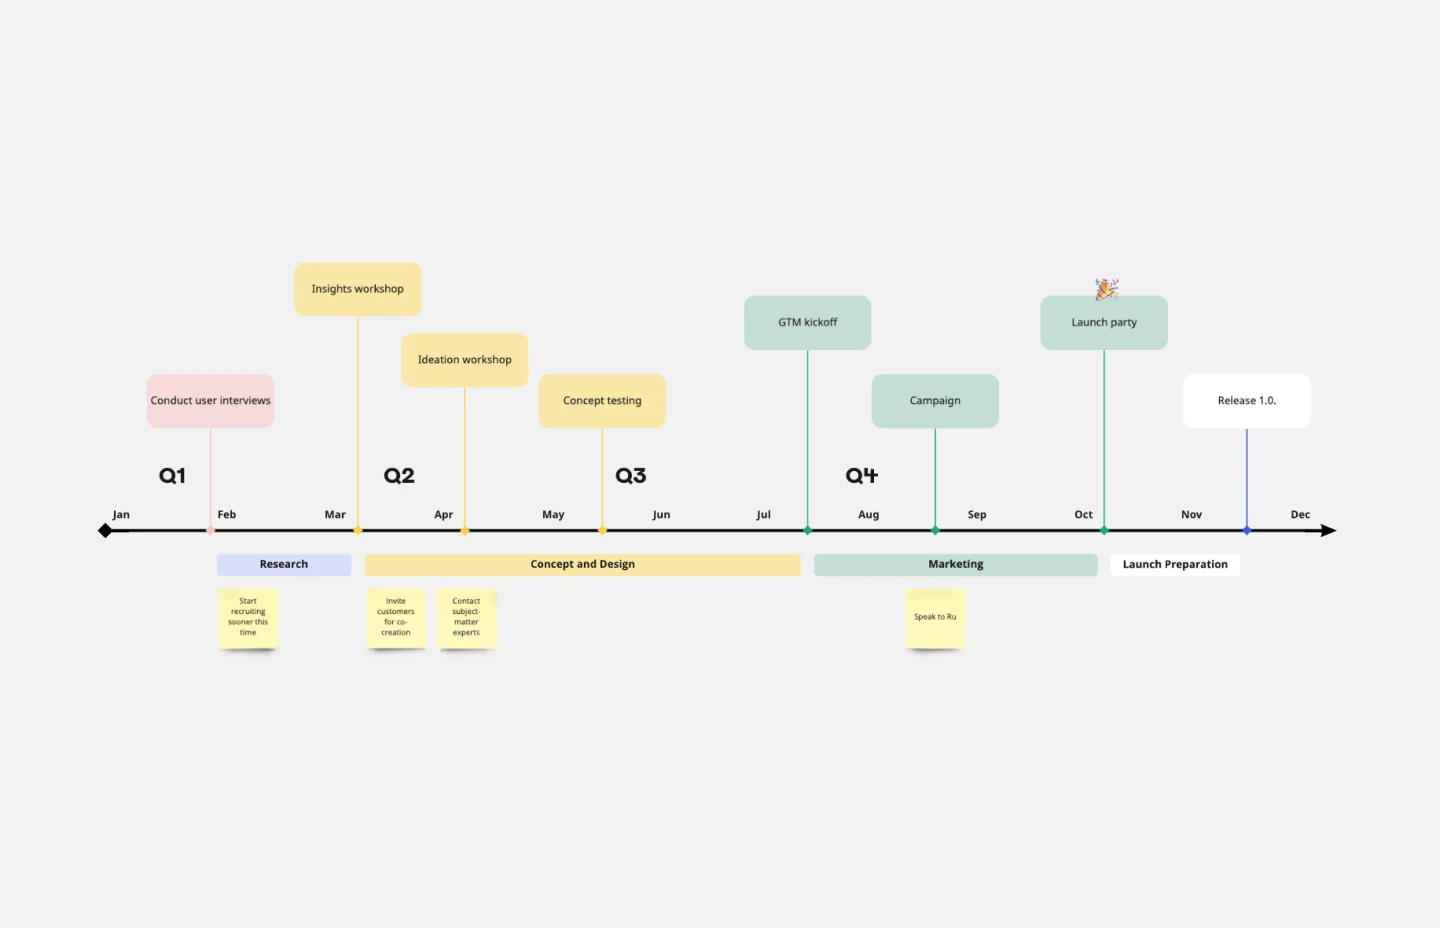
Timeline Template
Works best for:
Project Management, Flowcharts, Project Planning
A timeline displays a chronological order of important dates, and scheduled events. Timelines help product managers, project managers, and team members tell visual stories about progress and obstacles. Timelines enable teams to see at a glance what happened before, what progress is happening now, and what needs tackling in the future. Projects or products with specific purpose or deliverables should be based on a timeline to be successful. Use the timeline as a shared reference for start dates, end dates, and milestones.
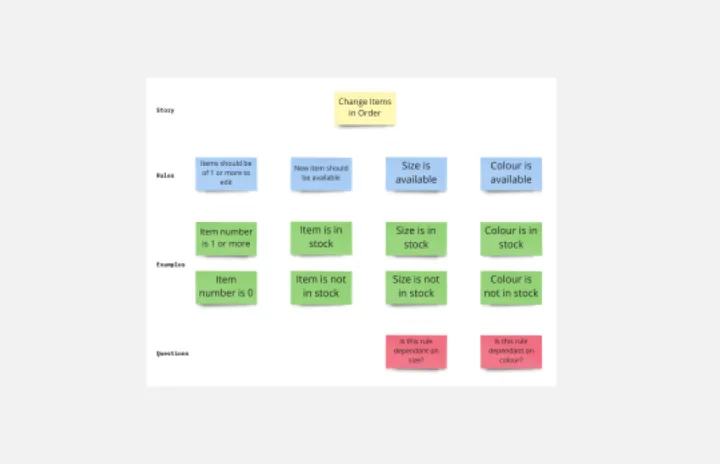
Example Mapping Template
Works best for:
Product Management, Mapping, Diagrams
To update your product in valuable ways—to recognize problem areas, add features, and make needed improvements—you have to walk in your users’ shoes. Example mapping (or user story mapping) can give you that perspective by helping cross-functional teams identify how users behave in different situations. These user stories are ideal for helping organizations form a development plan for Sprint planning or define the minimum amount of features needed to be valuable to customers.
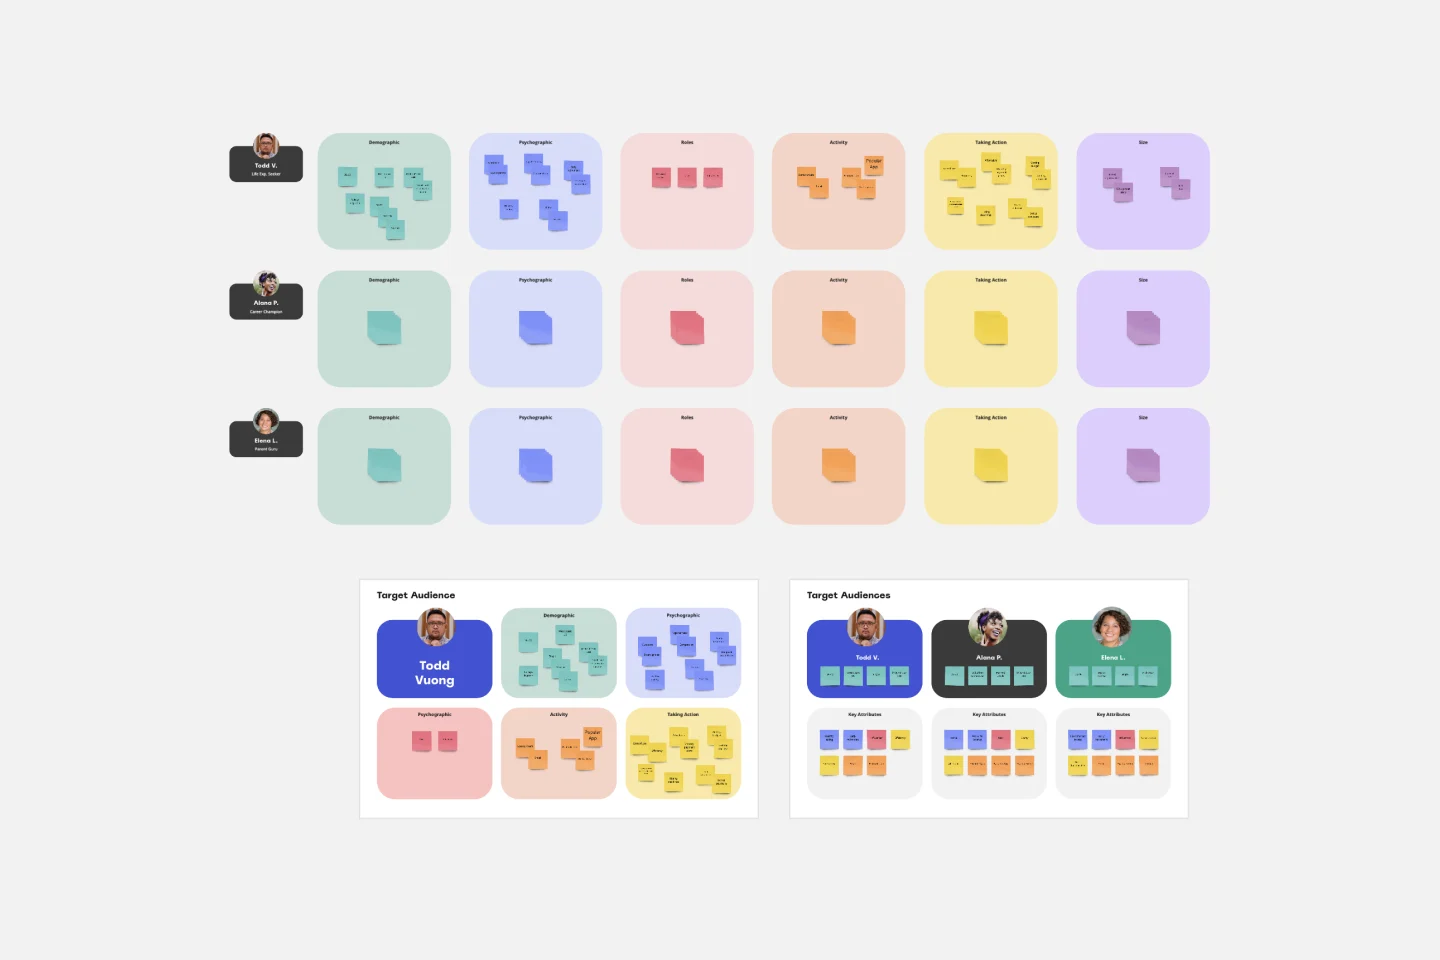
Target Audience Template
Works best for:
Marketing, Desk Research, Prioritization
Understanding your target audience is vital to business success. How can you market yourself effectively if you don’t know who you’re targeting? Using the Target Audience template, you can review valuable data about who your customers are and what they want from your product or service.

Azure Architecture Diagram Template
Works best for:
Software Development, Diagrams
The Azure Architecture Diagram Template is a diagram that will help you visualize the combination of any data and build and deploy custom machine learning models at scale. Azure is Microsoft’s cloud computing platform, designed to provide cloud-based services such as remote storage, database hosting, and centralized account management. Use Azure Architecture Diagram template to build sophisticated, transformational apps.

Onion Diagram Template
Works best for:
Diagramming, Mapping and Diagramming
The Onion Diagram Template is a distinct tool designed to visually represent layers of a specific concept, system, or process, akin to the layers of an onion. Each concentric layer of the diagram provides insights into a different aspect or phase of the topic at hand, moving from the core foundational element outwards to more peripheral components. One of the prime benefits of this template is its ability to offer hierarchical clarity. Users can immediately discern the importance, sequence, or interrelation of different elements within a system, facilitating enhanced comprehension and efficient decision-making.
Double Bubble Map Template
Works best for:
Diagramming, Mapping, Brainstorming
Double Bubble Map Template serves as a powerful tool to facilitate teamwork and streamline idea exploration. This adaptable template empowers teams to brainstorm, analyze, and compare concepts with ease, making it an invaluable asset for enhancing creativity and fostering clarity among team members.